Reporting Analytics
For campaigns created in May 2023 or later (discount codes, gift cards, loyalty programs, promotions), you can view your campaign analytics by navigating to the Analytics tab inside of the given campaign.
Contents:
How does it work?
You have two options to view analytics for a campaign when you click on a specific campaign in the Campaign list. The first one is in the Campaign Dashboard tab and the second one in the Analytics tab.
Campaign Dashboard
When you click on a campaign, the campaign Dashboard shows the campaign statistics as all-time data. It doesn't show daily, weekly, or monthly statistics.
Analytics
When you click on a campaign, go to the Analytics tab. It shows more detailed information for specific periods.
Supported Metrics by Campaign Type
The table below presents all the information that can be acquired via the Analytics tab by campaign type.
| Discount codes | Gift cards | Loyalty programs | Promotions | |
|---|---|---|---|---|
| Total discounted amount | + | + | ||
| Total rolled back discounted amount | + | + | ||
| Total orders amount | + | + | + | + |
| Total orders rolled back amount | + | + | + | + |
| Redemptions failed | + | + | + | + |
| Redemptions succeeded | + | + | + | + |
| Rollbacks failed | + | + | + | + |
| Rollbacks succeeded | + | + | + | + |
| Validations failed | + | + | + | + |
| Validations succeeded | + | + | + | + |
| Vouchers created | + | + | + | |
| Vouchers deleted | + | + | + | |
| Publications failed | + | + | + | |
| Publications succeeded | + | + | + | |
| Credits redeemed | + | |||
| Credits refunded | + | |||
| Created cards credits | + | |||
| Credits deleted | + | |||
| Credits subtracted | + | |||
| Credits added | + | |||
| Created card points | + | |||
| Points deleted | + | |||
| Points removed | + | |||
| Points added | + | |||
| Points accrued | + | |||
| Pending points activated | + | |||
| Points redeemed | + | |||
| Points refunded | + | |||
| Points expired | + | |||
| Points transferred in | + | |||
| Points transferred out | + |
Timeframe
You can change the time frame for the data in the date picker. Depending on the chosen time period, data will be presented either daily, weekly, or monthly.
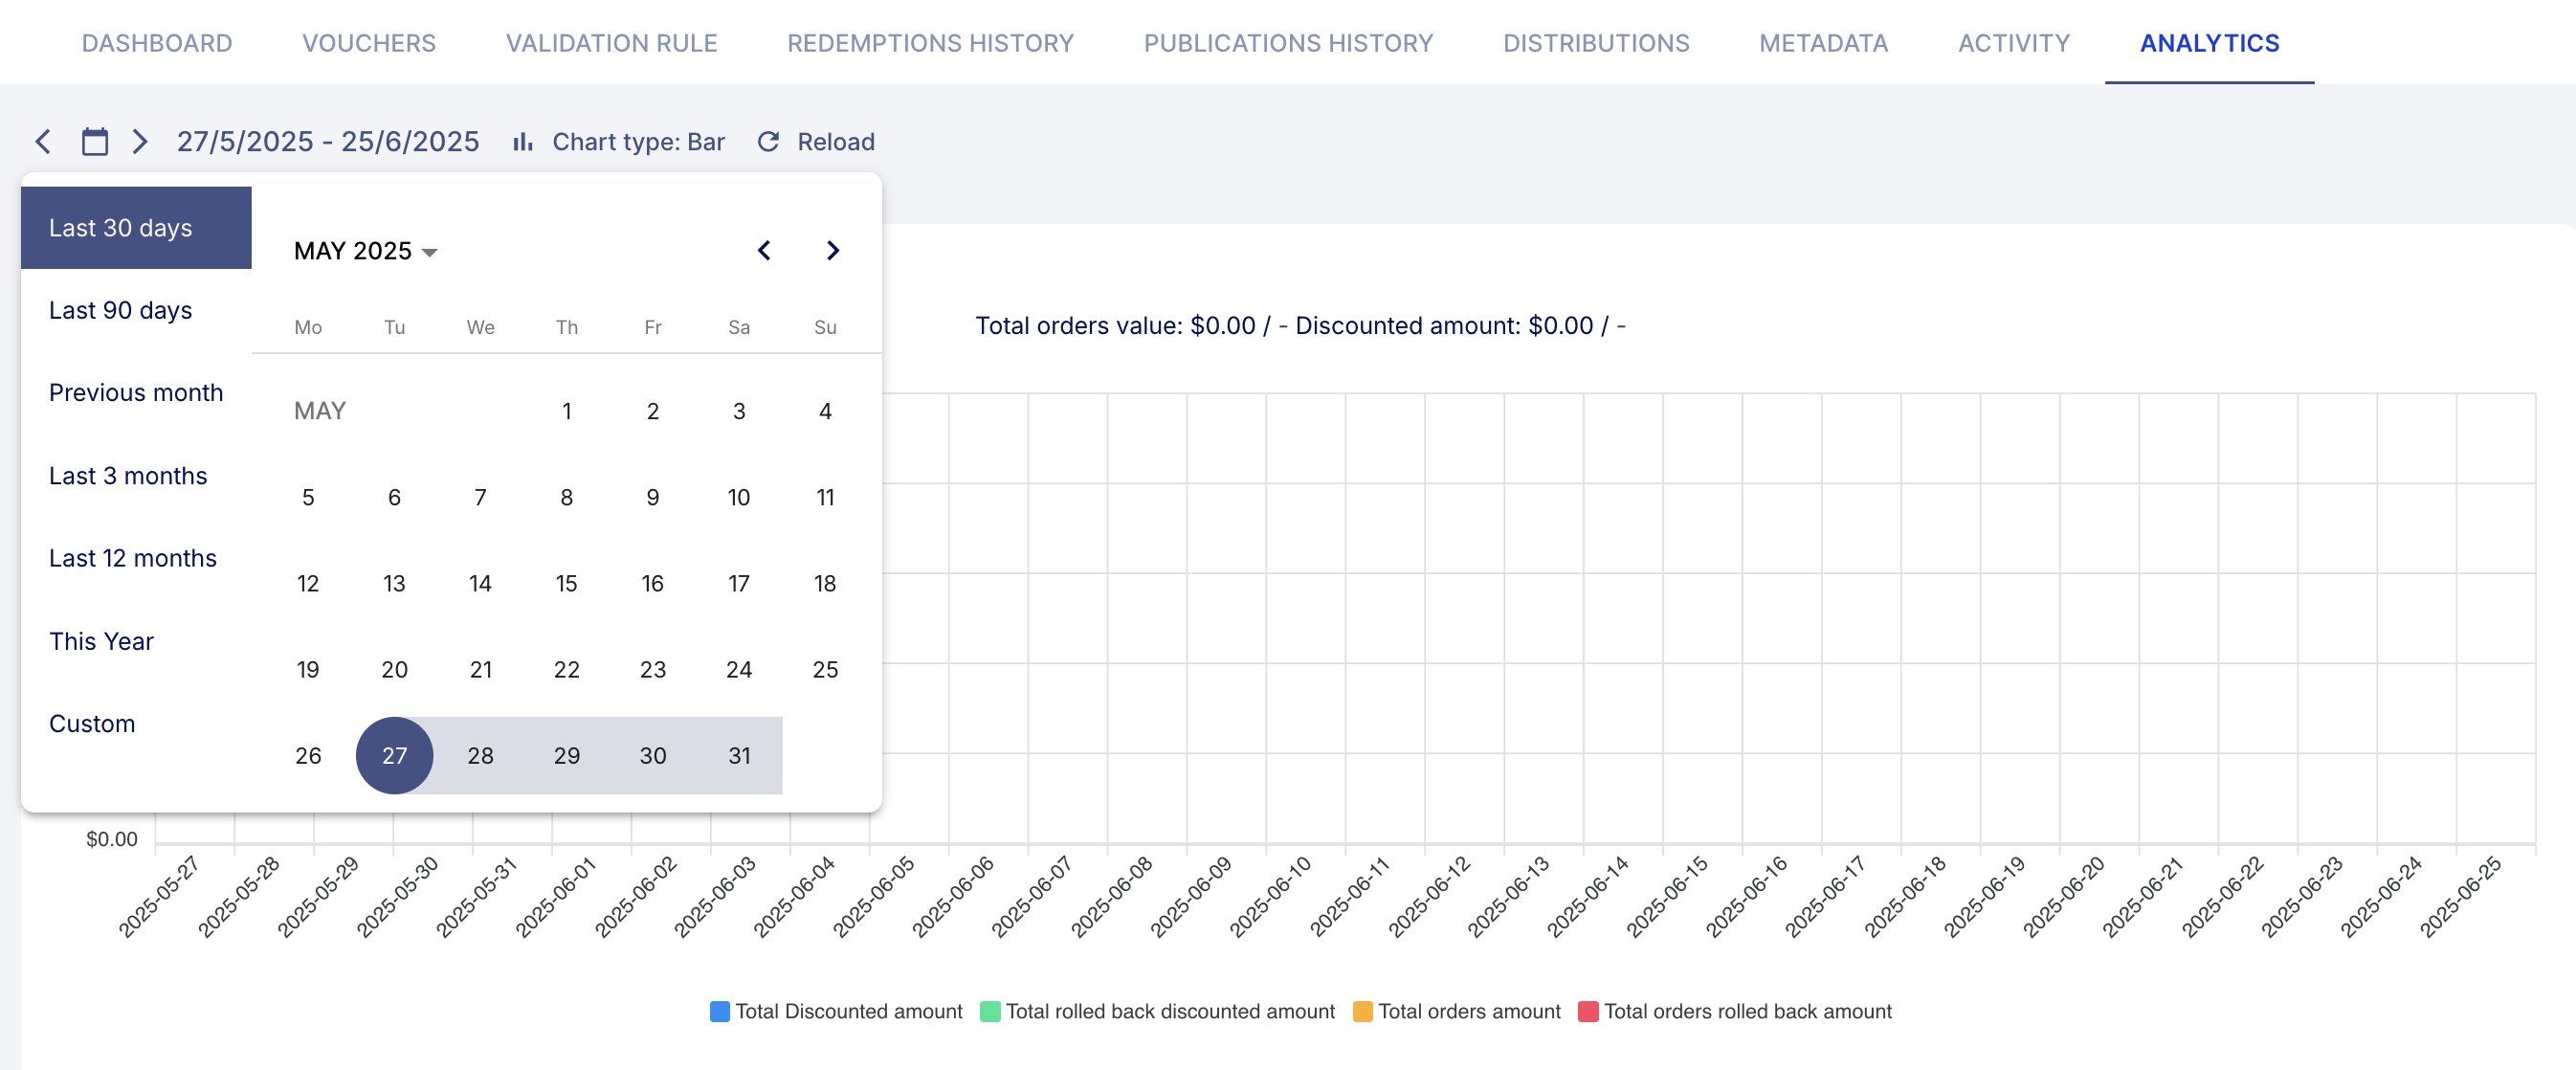
Chart Types
You can also choose either a bar chart, a line chart, or an area chart from the chart picker.
Orders
The first graph shows the financial aspects of the campaign. It shows data about the total discounted amount, total rolled back discount amount, total order amount, and total orders rolled back amount. Each data has its own color assigned to it as presented in the legend below the graph. You can deselect not-needed information by clicking on it in the legend.
Validations/Redemptions/Rollbacks
The second graph shows the statistics regarding the validations, redemptions, and rollbacks inside the campaign. It shows data about the number of failed redemptions, successful redemptions, failed rollbacks, successful rollbacks, failed validations, and successful validations. Each data has its own color assigned to it as presented in the legend below the graph. You can deselect not-needed information by clicking on it in the legend.
Vouchers/Publications
The third graph shows the statistics regarding the created vouchers and the vouchers that were published inside the campaign. It shows data about the number of created vouchers, deleted vouchers, failed publications, and successful publications. Each data has its own color assigned to it as presented in the legend below the graph. You can deselect not-needed information by clicking on it in the legend.